Third-party chemical distribution market: Growth opportunities led by including Barentz International BV and Biesterfeld AG - Technavio
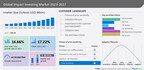
NEW YORK,Dec. 13, 2022/PRNewswire/ -- Thethird-party chemical distribution marketsize is forecast toincrease byUSD 121.73 millionfrom 2022 to 2027, at a CAGR of 7.6%,according to the recent market study by Technavio. The growth of the market will be driven by thegrowing focus on chemical distribution, the increasing emphasis on outsourcing distribution services, and the rising demand for third-party chemical distribution from MEA and APAC.
Technavio categorizes theglobal third-party chemical distribution marketas a part of theair freight and logistics market,which covers companies providing air freight transportation, courier, and logistics services, including package and mail delivery and customs agents.
Charts & data tables about market and segment sizes for a historic period of five (2017-2021) years have been covered in this report.Download The Sample Report
Technavio has extensively analyzed15 major vendors,includingBarentz International BV, Biesterfeld AG, BRENNTAG SE, HELM AG, ICC Chemical Corp., IMCD NV, Jebsen and Jessen Pte Ltd., Manuchar NV, Obegi Group, Omya International AG, Petrochem, Protea Chemicals, REDA Chemicals, Redox Ltd., and Sea Land Chemical Co.Theo Muller.
Key Benefits for Industry Players & Stakeholders –
- The report offers information on the criticality of vendor inputs, including R&D, CAPEX, and technology.
- It also provides detailed analyses of the market's competitive landscape and vendors' product offerings.
- The report also provides a qualitative and quantitative analysis of vendors to help clients understand the wider business environment as well as the strengths and weaknesses of key market players. Data is qualitatively analyzed to categorize vendors as pure play, category-focused, industry-focused, and diversified; it is quantitatively analyzed to categorize vendors as dominant, leading, strong, tentative, and weak.
Expand operations in the future -To get requisite details,ask for a custom report.
Customer Landscape - Analysis of Price Sensitivity, Adoption Lifecycle, Customer Purchase Basket, Adoption Rates, and Purchase Criteria by Technavio
- One of the core components of thecustomer landscapeisprice sensitivity,an analysis of which will help companies refinemarketing strategies to gain a competitive advantage.
- Another key aspect is price sensitivity drivers(purchases are undifferentiated, purchase is a key cost to buyers, and quality is not important), whichrange betweenLOW and HIGH.
- Furthermore, market adoption rates for all regions have been covered.
Download the sampleto get a holistic overview of the third-party chemical distribution market by industry experts to evaluate and develop growth strategies.
The market is segmented by type (commodity chemicals and speciality chemicals), application (textiles, automotive and transportation, agriculture, pharmaceuticals, and industrial), and geography( APAC,Europe,North America,南美, andMiddle EastandAfrica).
Segmentation by type (Inclusion/Exclusion)
- Inclusion:
- Commodity chemicals:
The commodity chemicals trailers segment grew gradually byUSD 137.52 millionin 2017 and continued to grow till 2021.这个部分是由基本的上升re of a wide range of end-user products, such as construction materials, adhesives, plastics, apparel, and tires. The increased demand for commodity chemicals in the personal care and aerospace industries is also contributing to the segment's growth.
To get detailed insights about inclusions and exclusions,buy now.
Related Reports –
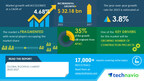
- Thechemical logistics marketis estimated to grow at a CAGR of 3.65% between 2022 and 2027. The size of the market is forecast to increase byUSD 53.66 billion. The growth of the chemical industry is notably driving the market growth, although factors such as the high cost of operations and capital-intensive business may impede the market growth.
- The化学品仓库和存储市场is estimated to grow at a CAGR of 3.88% between 2022 and 2027. The size of the market is forecast to increase byUSD 7321.57 million. The rise in international trade is notably driving the chemical warehousing and storage market growth, although factors such as the high cost of operations and the capital-intensive nature of the business may impede the market growth.
What are the key data covered in third-party chemical distribution market?
- CAGR of the market during the forecast period
- Detailed information on factors that will drive the growth of thethird-party chemical distribution marketbetween 2023 and 2027
- Precise estimation of the size of thethird-party chemical distribution marketand its contribution to the parent market
- Accurate predictions about upcoming trends and changes in consumer behavior
- 增长的云数据仓库arket industry across APAC,North America,Europe,Middle EastandAfrica, and南美
- Thorough analysis of the market's competitive landscape and detailed information about vendors
- Comprehensive analysis of factors that will challenge the growth ofthird-party chemical distribution marketvendors
Third-Party Chemical Distribution Market Scope |
|
Report Coverage |
Details |
Page number |
168 |
Base year |
2022 |
Historic period |
2017-2021 |
Forecast period |
2023-2027 |
Growth momentum & CAGR |
Accelerate at a CAGR of 7.6% |
Market growth 2023-2027 |
USD 121.73 million |
Market structure |
Fragmented |
2022 - 2023年同比增长(%) |
6.92 |
Regional analysis |
APAC, Europe, North America, South America, and Middle East and Africa |
Performing market contribution |
APAC at 47% |
关键在此ies |
US, China, India, Germany, and UK |
Competitive landscape |
Leading Vendors, Market Positioning of Vendors, Competitive Strategies, and Industry Risks |
Key companies profiled |
Barentz International BV, Biesterfeld AG, BRENNTAG SE, HELM AG, ICC Chemical Corp., IMCD NV, Jebsen and Jessen Pte Ltd., Manuchar NV, Obegi Group, Omya International AG, Petrochem, Protea Chemicals, REDA Chemicals, Redox Ltd., Sea Land Chemical Co., Snetor SA, Stockmeier Holding GmbH, Tricon Energy Inc., Univar Solutions Inc., and Wilbur Ellis Holdings Inc. |
Market dynamics |
Parent market analysis, market growth inducers and obstacles, fast-growing and slow-growing segment analysis, COVID-19 impact and recovery analysis and future consumer dynamics, and market condition analysis for the forecast period. |
Customization purview |
If our report has not included the data that you are looking for, you can reach out to our analysts and get segments customized. |
Table of Contents:
1 Executive Summary
- 1.1 Market overview
- 又美观it 01: Executive Summary – Chart on Market Overview
- 又美观it 02: Executive Summary – Data Table on Market Overview
- 又美观it 03: Executive Summary – Chart on Global Market Characteristics
- 又美观it 04: Executive Summary – Chart on Market by Geography
- 又美观it 05: Executive Summary – Chart on Market Segmentation by Type
- 又美观it 06: Executive Summary – Chart on Market Segmentation by Application
- 展览07:执行夏ary – Chart on Incremental Growth
- 又美观it 08: Executive Summary – Data Table on Incremental Growth
- 又美观it 09: Executive Summary – Chart on Vendor Market Positioning
2 Market Landscape
- 2.1 Market ecosystem
- 又美观it 10: Parent market
- 又美观it 11: Market Characteristics
3 Market Sizing
- 3.1 Market definition
- 又美观it 12: Offerings of vendors included in the market definition
- 3.2 Market segment analysis
- 又美观it 13: Market segments
- 3.3 Market size 2022
- 3.4 Market outlook: Forecast for 2022-2027
- 又美观it 14: Chart on Global - Market size and forecast 2022-2027 ($ million)
- 又美观it 15: Data Table on Global - Market size and forecast 2022-2027 ($ million)
- 又美观it 16: Chart on Global Market: Year-over-year growth 2022-2027 (%)
- 又美观it 17: Data Table on Global Market: Year-over-year growth 2022-2027 (%)
4 Historic Market Size
- 4.1 Global third-party chemical distribution market 2017 - 2021
- 又美观it 18: Historic Market Size – Data Table on Global third-party chemical distribution market 2017 - 2021 ($ million)
- 4.2 Type Segment Analysis 2017 - 2021
- 又美观it 19: Historic Market Size – Type Segment 2017 - 2021 ($ million)
- 4.3 Distribution channel Segment Analysis 2017 - 2021
- 又美观it 20: Historic Market Size – Distribution channel Segment 2017 - 2021 ($ million)
- 4.4 Geography Segment Analysis 2017 - 2021
- 又美观it 21: Historic Market Size – Geography Segment 2017 - 2021 ($ million)
- 4.5 Country Segment Analysis 2017 - 2021
- 又美观it 22: Historic Market Size – Country Segment 2017 - 2021 ($ million)
5 Five Forces Analysis
- 5.1 Five forces summary
- 又美观it 23: Five forces analysis - Comparison between2022 and 2027
- 5.2 Bargaining power of buyers
- 又美观it 24: Chart on Bargaining power of buyers – Impact of key factors 2022 and 2027
- 5.3 Bargaining power of suppliers
- 又美观it 25: Bargaining power of suppliers – Impact of key factors in 2022 and 2027
- 5.4 Threat of new entrants
- 又美观it 26: Threat of new entrants – Impact of key factors in 2022 and 2027
- 5.5 Threat of substitutes
- 又美观it 27: Threat of substitutes – Impact of key factors in 2022 and 2027
- 5.6 Threat of rivalry
- 又美观it 28: Threat of rivalry – Impact of key factors in 2022 and 2027
- 5.7 Market condition
- 又美观it 29: Chart on Market condition - Five forces 2022 and 2027
6 Market Segmentation by Type
- 6.1 Market segments
- 又美观it 30: Chart on Type - Market share 2022-2027 (%)
- 又美观it 31: Data Table on Type - Market share 2022-2027 (%)
- 6.2 Comparison by Type
- 又美观it 32: Chart on Comparison by Type
- 又美观it 33: Data Table on Comparison by Type
- 6.3 Commodity chemicals - Market size and forecast 2022-2027
- 又美观it 34: Chart on Commodity chemicals - Market size and forecast 2022-2027 ($ million)
- 又美观it 35: Data Table on Commodity chemicals - Market size and forecast 2022-2027 ($ million)
- 又美观it 36: Chart on Commodity chemicals - Year-over-year growth 2022-2027 (%)
- 又美观it 37: Data Table on Commodity chemicals - Year-over-year growth 2022-2027 (%)
- 6.4 Speciality chemicals - Market size and forecast 2022-2027
- 又美观it 38: Chart on Speciality chemicals - Market size and forecast 2022-2027 ($ million)
- 又美观it 39: Data Table on Speciality chemicals - Market size and forecast 2022-2027 ($ million)
- 又美观it 40: Chart on Speciality chemicals - Year-over-year growth 2022-2027 (%)
- 又美观it 41: Data Table on Speciality chemicals - Year-over-year growth 2022-2027 (%)
- 6.5 Market opportunity by Type
- 又美观it 42: Market opportunity by Type ($ million)
7 Market Segmentation by Application
- 7.1 Market segments
- 又美观it 43: Chart on Application - Market share 2022-2027 (%)
- 又美观it 44: Data Table on Application - Market share 2022-2027 (%)
- 7.2 Comparison by Application
- 又美观it 45: Chart on Comparison by Application
- 又美观it 46: Data Table on Comparison by Application
- 7.3 Textiles - Market size and forecast 2022-2027
- 又美观it 47: Chart on Textiles - Market size and forecast 2022-2027 ($ million)
- 又美观it 48: Data Table on Textiles - Market size and forecast 2022-2027 ($ million)
- 又美观it 49: Chart on Textiles - Year-over-year growth 2022-2027 (%)
- 又美观it 50: Data Table on Textiles - Year-over-year growth 2022-2027 (%)
- 7.4 Automotive and transportation - Market size and forecast 2022-2027
- 又美观it 51: Chart on Automotive and transportation - Market size and forecast 2022-2027 ($ million)
- 又美观it 52: Data Table on Automotive and transportation - Market size and forecast 2022-2027 ($ million)
- 又美观it 53: Chart on Automotive and transportation - Year-over-year growth 2022-2027 (%)
- 又美观it 54: Data Table on Automotive and transportation - Year-over-year growth 2022-2027 (%)
- 7.5 Agriculture - Market size and forecast 2022-2027
- 又美观it 55: Chart on Agriculture - Market size and forecast 2022-2027 ($ million)
- 又美观it 56: Data Table on Agriculture - Market size and forecast 2022-2027 ($ million)
- 又美观it 57: Chart on Agriculture - Year-over-year growth 2022-2027 (%)
- 又美观it 58: Data Table on Agriculture - Year-over-year growth 2022-2027 (%)
- 7.6 Pharmaceuticals - Market size and forecast 2022-2027
- 又美观it 59: Chart on Pharmaceuticals - Market size and forecast 2022-2027 ($ million)
- 又美观it 60: Data Table on Pharmaceuticals - Market size and forecast 2022-2027 ($ million)
- 又美观it 61: Chart on Pharmaceuticals - Year-over-year growth 2022-2027 (%)
- 又美观it 62: Data Table on Pharmaceuticals - Year-over-year growth 2022-2027 (%)
- 7.7 Industrial - Market size and forecast 2022-2027
- 又美观it 63: Chart on Industrial - Market size and forecast 2022-2027 ($ million)
- 又美观it 64: Data Table on Industrial - Market size and forecast 2022-2027 ($ million)
- 又美观it 65: Chart on Industrial - Year-over-year growth 2022-2027 (%)
- 又美观it 66: Data Table on Industrial - Year-over-year growth 2022-2027 (%)
- 7.8 Market opportunity by Application
- 又美观it 67: Market opportunity by Application ($ million)
8 Customer Landscape
- 8.1 Customer landscape overview
- 又美观it 68: Analysis of price sensitivity, lifecycle, customer purchase basket, adoption rates, and purchase criteria
9 Geographic Landscape
- 9.1 Geographic segmentation
- 又美观it 69: Chart on Market share by geography 2022-2027 (%)
- 又美观it 70: Data Table on Market share by geography 2022-2027 (%)
- 9.2 Geographic comparison
- 又美观it 71: Chart on Geographic comparison
- 又美观it 72: Data Table on Geographic comparison
- 9.3 APAC - Market size and forecast 2022-2027
- 又美观it 73: Chart on APAC - Market size and forecast 2022-2027 ($ million)
- 又美观it 74: Data Table on APAC - Market size and forecast 2022-2027 ($ million)
- 又美观it 75: Chart on APAC - Year-over-year growth 2022-2027 (%)
- 又美观it 76: Data Table on APAC - Year-over-year growth 2022-2027 (%)
- 9.4Europe- Market size and forecast 2022-2027
- 又美观it 77: Chart onEurope- Market size and forecast 2022-2027 ($ million)
- 又美观it 78: Data Table onEurope- Market size and forecast 2022-2027 ($ million)
- 又美观it 79: Chart onEurope- Year-over-year growth 2022-2027 (%)
- 又美观it 80: Data Table onEurope- Year-over-year growth 2022-2027 (%)
- 9.5North America- Market size and forecast 2022-2027
- 又美观it 81: Chart onNorth America- Market size and forecast 2022-2027 ($ million)
- 又美观it 82: Data Table onNorth America- Market size and forecast 2022-2027 ($ million)
- 又美观it 83: Chart onNorth America- Year-over-year growth 2022-2027 (%)
- 又美观it 84: Data Table onNorth America- Year-over-year growth 2022-2027 (%)
- 9.6南美- Market size and forecast 2022-2027
- 又美观it 85: Chart on南美- Market size and forecast 2022-2027 ($ million)
- 又美观it 86: Data Table on南美- Market size and forecast 2022-2027 ($ million)
- 又美观it 87: Chart on南美- Year-over-year growth 2022-2027 (%)
- 又美观it 88: Data Table on南美- Year-over-year growth 2022-2027 (%)
- 9.7Middle EastandAfrica- Market size and forecast 2022-2027
- 又美观it 89: Chart onMiddle EastandAfrica- Market size and forecast 2022-2027 ($ million)
- 又美观it 90: Data Table onMiddle EastandAfrica- Market size and forecast 2022-2027 ($ million)
- 又美观it 91: Chart onMiddle EastandAfrica- Year-over-year growth 2022-2027 (%)
- 又美观it 92: Data Table onMiddle EastandAfrica- Year-over-year growth 2022-2027 (%)
- 9.8China- Market size and forecast 2022-2027
- 又美观it 93: Chart onChina- Market size and forecast 2022-2027 ($ million)
- 又美观it 94: Data Table onChina- Market size and forecast 2022-2027 ($ million)
- 又美观it 95: Chart onChina- Year-over-year growth 2022-2027 (%)
- 又美观it 96: Data Table onChina- Year-over-year growth 2022-2027 (%)
- 9.9 US - Market size and forecast 2022-2027
- 又美观it 97: Chart on US - Market size and forecast 2022-2027 ($ million)
- 又美观it 98: Data Table on US - Market size and forecast 2022-2027 ($ million)
- 又美观it 99: Chart on US - Year-over-year growth 2022-2027 (%)
- 又美观it 100: Data Table on US - Year-over-year growth 2022-2027 (%)
- 9.10Germany- Market size and forecast 2022-2027
- 又美观it 101: Chart onGermany- Market size and forecast 2022-2027 ($ million)
- 又美观it 102: Data Table onGermany- Market size and forecast 2022-2027 ($ million)
- 又美观it 103: Chart onGermany- Year-over-year growth 2022-2027 (%)
- 又美观it 104: Data Table onGermany- Year-over-year growth 2022-2027 (%)
- 9.11India- Market size and forecast 2022-2027
- 又美观it 105: Chart onIndia- Market size and forecast 2022-2027 ($ million)
- 又美观it 106: Data Table onIndia- Market size and forecast 2022-2027 ($ million)
- 又美观it 107: Chart onIndia- Year-over-year growth 2022-2027 (%)
- 又美观it 108: Data Table onIndia- Year-over-year growth 2022-2027 (%)
- 9.12 UK - Market size and forecast 2022-2027
- 又美观it 109: Chart on UK - Market size and forecast 2022-2027 ($ million)
- 又美观it 110: Data Table on UK - Market size and forecast 2022-2027 ($ million)
- 又美观it 111: Chart on UK - Year-over-year growth 2022-2027 (%)
- 又美观it 112: Data Table on UK - Year-over-year growth 2022-2027 (%)
- 9.13 Market opportunity by geography
- 又美观it 113: Market opportunity by geography ($ million)
10 Drivers, Challenges, and Trends
- 10.1 Market drivers
- 10.2 Market challenges
- 10.3 Impact of drivers and challenges
- 114年展览:妊娠和分娩综合管理t of drivers and challenges in 2022 and 2027
- 10.4 Market trends
11 Vendor Landscape
- 11.1 Overview
- 11.2 Vendor landscape
- 又美观it 115: Overview on Criticality of inputs and Factors of differentiation
- 11.3 Landscape disruption
- 又美观it 116: Overview on factors of disruption
- 11.4 Industry risks
- 又美观it 117: Impact of key risks on business
12 Vendor Analysis
- 12.1 Vendors covered
- 又美观it 118: Vendors covered
- 12.2 Market positioning of vendors
- 又美观it 119: Matrix on vendor position and classification
- 12.3 Barentz International BV
- 又美观it 120: Barentz International BV - Overview
- 又美观it 121: Barentz International BV - Product / Service
- 又美观it 122: Barentz International BV - Key offerings
- 12.4 Biesterfeld AG
- 又美观it 123: Biesterfeld AG - Overview
- 又美观it 124: Biesterfeld AG - Product / Service
- 又美观it 125: Biesterfeld AG - Key offerings
- 12.5 BRENNTAG SE
- 又美观it 126: BRENNTAG SE - Overview
- 又美观it 127: BRENNTAG SE - Business segments
- 又美观it 128: BRENNTAG SE - Key offerings
- 又美观it 129: BRENNTAG SE - Segment focus
- 12.6 HELM AG
- 展览130:舵AG -概述
- 又美观it 131: HELM AG - Product / Service
- 又美观it 132: HELM AG - Key news
- 又美观it 133: HELM AG - Key offerings
- 12.7 ICC Chemical Corp.
- 又美观it 134: ICC Chemical Corp. - Overview
- 又美观it 135: ICC Chemical Corp. - Product / Service
- 又美观it 136: ICC Chemical Corp. - Key offerings
- 12.8 IMCD NV
- 又美观it 137: IMCD NV - Overview
- 又美观it 138: IMCD NV - Business segments
- 又美观it 139: IMCD NV - Key offerings
- 又美观it 140: IMCD NV - Segment focus
- 12.9 Jebsen and Jessen Pte Ltd.
- 又美观it 141: Jebsen and Jessen Pte Ltd. - Overview
- 又美观it 142: Jebsen and Jessen Pte Ltd. - Product / Service
- 又美观it 143: Jebsen and Jessen Pte Ltd. - Key offerings
- 12.10 Omya International AG
- 又美观it 144: Omya International AG - Overview
- 又美观it 145: Omya International AG - Product / Service
- 又美观it 146: Omya International AG - Key offerings
- 12.11 Redox Ltd.
- 又美观it 147: Redox Ltd. - Overview
- 又美观it 148: Redox Ltd. - Product / Service
- 又美观it 149: Redox Ltd. - Key offerings
- 12.12 Sea Land Chemical Co.
- 又美观it 150: Sea Land Chemical Co. - Overview
- 又美观it 151: Sea Land Chemical Co. - Product / Service
- 又美观it 152: Sea Land Chemical Co. - Key offerings
- 12.13 Snetor SA
- 又美观it 153: Snetor SA - Overview
- 又美观it 154: Snetor SA - Product / Service
- 又美观it 155: Snetor SA - Key offerings
- 12.14 Stockmeier Holding GmbH
- 又美观it 156: Stockmeier Holding GmbH - Overview
- 又美观it 157: Stockmeier Holding GmbH - Product / Service
- 又美观it 158: Stockmeier Holding GmbH - Key offerings
- 12.15 Tricon Energy Inc.
- 又美观it 159: Tricon Energy Inc. - Overview
- 又美观it 160: Tricon Energy Inc. - Product / Service
- 又美观it 161: Tricon Energy Inc. - Key offerings
- 12.16 Univar Solutions Inc.
- 又美观it 162: Univar Solutions Inc. - Overview
- 又美观it 163: Univar Solutions Inc. - Business segments
- 又美观it 164: Univar Solutions Inc. - Key news
- 又美观it 165: Univar Solutions Inc. - Key offerings
- 又美观it 166: Univar Solutions Inc. - Segment focus
- 12.17 Wilbur Ellis Holdings Inc.
- 又美观it 167: Wilbur Ellis Holdings Inc. - Overview
- 又美观it 168: Wilbur Ellis Holdings Inc. - Product / Service
- 又美观it 169: Wilbur Ellis Holdings Inc. - Key offerings
13 Appendix
- 13.1 Scope of the report
- 13.2 Inclusions and exclusions checklist
- 又美观it 170: Inclusions checklist
- 又美观it 171: Exclusions checklist
- 13.3 Currency conversion rates for US$
- 又美观it 172: Currency conversion rates for US$
- 13.4 Research methodology
- 又美观it 173: Research methodology
- 又美观it 174: Validation techniques employed for market sizing
- 又美观it 175: Information sources
- 13.5 List of abbreviations
- 又美观it 176: List of abbreviations
Technavio is a leading global technology research and advisory company. Their research and analysis focus on emerging market trends and provides actionable insights to help businesses identify market opportunities and develop effective strategies to optimize their market positions. With over 500 specialized analysts, Technavio's report library consists of more than 17,000 reports and counting, covering 800 technologies, spanning across 50 countries. Their client base consists of enterprises of all sizes, including more than 100 Fortune 500 companies. This growing client base relies on Technavio's comprehensive coverage, extensive research, and actionable market insights to identify opportunities in existing and potential markets and assess their competitive positions within changing market scenarios.
Contact
Technavio Research
Jesse Maida
Media & Marketing Executive
US: +1 844 364 1100
UK: +44 203 893 3200
Email:[email protected]
Website:www.technavio.com/
SOURCE Technavio


Share this article