Construction machinery market: Growth opportunities led by AB Volvo, Caterpillar Inc, Deere and Co - Technavio

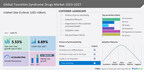
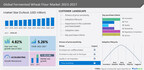
NEW YORK,Dec. 20, 2022/PRNewswire/ -- Theconstruction machinery marketsize is forecast to increase byUSD 41.41 billionfrom 2022 to 2027, at aCAGR of 4.3%,according to the recent market study by Technavio. The growth of the market will be driven by increased investment in infrastructure, expanding manufacturing and distribution facilities, and new product launches.
Technavio categorizes the global construction machinery market as a part of theglobal construction machinery and heavy trucks market, within the global capital goods market. The parent market covers a variety of product categories, including heavy-duty trucks, heavy earthmoving equipment, compact earthmoving equipment, road construction, and compaction equipment, crushing and screening equipment, concrete equipment, civil engineering equipment, lifting equipment, and other related equipment.
Charts & data tables about market and segment sizes for a historic period of five (2017-2021) years have been covered in this report.Download the Sample Report
The market is segmented byapplication (commercial, residential, and infrastructure), product (earthmoving machinery, material handling machinery, concrete and road construction machinery, and others), and geography (APAC,North America,Europe,南美, andMiddle EastandAfrica).
Segmentation by application (commercial, residential, and infrastructure),
- Commercial: The commercial segment includes structures that are used for business, including stores, hotels, restaurants, offices, industrial buildings, schools, and hospitals. This market is anticipated to expand as both developed and developing economies are anticipated to make significant investments throughout the forecast period. During the projected period, expansion in the commercial sector will support growth in the global market for construction machines. Globally, the number of employees and office spaces has increased due to of the emergence of multinational corporations. A major factor driving the demand for construction equipment in commercial areas is the growth in technical and business parks, which is projected to continue during the projected period.
To get detailed insights about inclusions and exclusions,buy the report
Technavio has extensively analyzed 15 major vendors, includingAB Volvo, Caterpillar Inc., Deere and Co., Doosan Bobcat Inc., Hitachi Ltd., Hyundai Motor Co., J C Bamford Excavators Ltd., Kawasaki Heavy Industries Ltd., Kobe Steel Ltd., Komatsu Ltd., Liebherr International AG, Linamar Corp., Manitou Group, SANY Group, Tadano Ltd., Terex Corp., XCMG Group, Zoomlion Heavy Industry Science and Technology Co. Ltd., Yanmar Holdings Co. Ltd., and CNH Industrial NV
Key benefits for industry players & stakeholders –
- The report offers information on the criticality of vendor inputs, includingR&D, CAPEX, and technology.
- It also provides detailed analyses of themarket's competitive landscape and vendors' product offerings.
- The report also provides a qualitative and quantitative analysis of vendors to help clients understand the wider business environment as well as the strengths and weaknesses of key market players. Data is qualitatively analyzed to categorize vendors as pure play, category-focused, industry-focused, and diversified; it is quantitatively analyzed to categorize vendors as dominant, leading, strong, tentative, and weak.
Expand operations in the future - To get requisite details,ask for a custom report.
Customer landscape - Analysis of price sensitivity, adoption lifecycle, customer purchase basket, adoption rates, and purchase criteria by Technavio
- One of the core components of the customer landscape is price sensitivity, an analysis of which will help companies refine marketing strategies to gain a competitive advantage.
- Another key aspect is price sensitivity drivers (purchases are undifferentiated, the purchase is a key cost to buyers, and quality is not important), which range between LOW and HIGH.
- Furthermore, market adoption rates for all regions have been covered.
Get a holistic overview of the construction machinery market by industry experts to evaluate and develop growth strategies.Download the Sample
Related Reports:
Forklift Trucks Marketby Class Type, Type and Geography - Forecast and Analysis 2023-2027:The forklift trucks market is estimated to grow at aCAGR of 4.32%between 2022 and 2027. The size of the market is forecast to increase by357 thousand units.This report extensively covers market segmentation by class type (class iii, class v, class i, class ii, and class iv), type (electric and internal combustion engine), and geography (APAC,Europe,North America,Middle EastandAfrica, and南美).
Vacuum Truck Marketby Application and Geography - Forecast and Analysis 2022-2026:The vacuum truck market share is expected to increase byUSD 416.93million from 2021 to 2026, and the market's growth momentum will accelerate at a CAGR of 6.41%. The report extensively covers the vacuum truck market segmentation by application (industrial, excavation, general cleaning, and others) and geography (North America,Europe据美联社AC,南美, and theMiddle EastandAfrica).
Register for a free trial today and gain instant access to 17,000+ market research reports.
Technavio's SUBSCRIPTION platform
What are the key data covered in this construction machinery market report?
- CAGR of the market during the forecast period
- Detailed information on factors that will drive the growth of the construction machinery market between 2023 and 2027
- Precise estimation of the size of the construction machinery market and its contribution to the parent market
- Accurate predictions about upcoming trends and changes in consumer behavior
- Growth of the construction machinery market across APAC,North America,Europe,南美, andMiddle EastandAfrica
- A thorough analysis of the market's competitive landscape and detailed information about vendors
- Comprehensive analysis of factors that will challenge the growth of construction machinery market vendors
Construction Machinery Market Scope |
|
Report Coverage |
Details |
Page number |
183 |
Base year |
2022 |
Historic period |
2017-2021 |
Forecast period |
2023-2027 |
Growth momentum & CAGR |
Accelerate at a CAGR of 4.3% |
Market growth 2023-2027 |
USD 41.41 billion |
Market structure |
Fragmented |
YoY growth 2022-2023 (%) |
3.5 |
Regional analysis |
APAC, North America, Europe, South America, and Middle East and Africa |
Performing market contribution |
APAC at 42% |
Key countries |
US, China, India, Japan, and Germany |
Competitive landscape |
Leading Vendors, Market Positioning of Vendors, Competitive Strategies, and Industry Risks |
Key companies profiled |
AB Volvo, Caterpillar Inc., Deere and Co., Doosan Bobcat Inc., Hitachi Ltd., Hyundai Motor Co., J C Bamford Excavators Ltd., Kawasaki Heavy Industries Ltd., Kobe Steel Ltd., Komatsu Ltd., Liebherr International AG, Linamar Corp., Manitou Group, SANY Group, Tadano Ltd., Terex Corp., XCMG Group, Zoomlion Heavy Industry Science and Technology Co. Ltd., Yanmar Holdings Co. Ltd., and CNH Industrial NV |
Market dynamics |
Parent Market Analysis; Market growth inducers and obstacles; Fast-growing and slow-growing segment analysis for the forecast period |
Customization purview |
If our report has not included the data that you are looking for, you can reach out to our analysts and get segments customized. |
Customization purview |
If our report has not included the data that you are looking for, you can reach out to our analysts and get segments customized. |
Browse for Technavio "Industrials" Research Reports
Table of Contents
1 Executive Summary
- 1.1 Market overview
- Exhibit 01: Executive Summary – Chart on Market Overview
- Exhibit 02: Executive Summary – Data Table on Market Overview
- Exhibit 03: Executive Summary – Chart on Global Market Characteristics
- Exhibit 04: Executive Summary – Chart on Market by Geography
- Exhibit 05: Executive Summary – Chart on Market Segmentation by Application
- Exhibit 06: Executive Summary – Chart on Market Segmentation by Product
- Exhibit 07: Executive Summary – Chart on Incremental Growth
- Exhibit 08: Executive Summary – Data Table on Incremental Growth
- Exhibit 09: Executive Summary – Chart on Vendor Market Positioning
2 Market Landscape
- 2.1 Market ecosystem
- Exhibit 10: Parent market
- Exhibit 11: Market Characteristics
3 Market Sizing
- 3.1 Market definition
- Exhibit 12: Offerings of vendors included in the market definition
- 3.2 Market segment analysis
- Exhibit 13: Market segments
- 3.3 Market size 2022
- 3.4 Market outlook: Forecast for 2022-2027
- Exhibit 14: Chart on Global - Market size and forecast 2022-2027 ($ billion)
- Exhibit 15: Data Table on Global - Market size and forecast 2022-2027 ($ billion)
- Exhibit 16: Chart on Global Market: Year-over-year growth 2022-2027 (%)
- Exhibit 17: Data Table on Global Market: Year-over-year growth 2022-2027 (%)
4 Historic Market Size
- 4.1 Global Construction Machinery Market 2017 - 2021
- Exhibit 18: Historic Market Size – Data Table on Global Construction Machinery Market 2017 - 2021 ($ billion)
- 4.2 Applicaton Segment Analysis 2017 - 2021
- Exhibit 19: Historic Market Size – Applicaton Segment 2017 - 2021 ($ billion)
- 4.3 Product Segment Analysis 2017 - 2021
- Exhibit 20: Historic Market Size – Product Segment 2017 - 2021 ($ billion)
- 4.4 Geography Segment Analysis 2017 - 2021
- Exhibit 21: Historic Market Size – Geography Segment 2017 - 2021 ($ billion)
- 4.5 Country Segment Analysis 2017 - 2021
- Exhibit 22: Historic Market Size – Country Segment 2017 - 2021 ($ billion)
5 Five Forces Analysis
- 5.1 Five forces summary
- Exhibit 23: Five forces analysis - Comparison between 2022 and 2027
- 5.2 Bargaining power of buyers
- Exhibit 24: Chart on Bargaining power of buyers – Impact of key factors 2022 and 2027
- 5.3 Bargaining power of suppliers
- Exhibit 25: Bargaining power of suppliers – Impact of key factors in 2022 and 2027
- 5.4 Threat of new entrants
- Exhibit 26: Threat of new entrants – Impact of key factors in 2022 and 2027
- 5.5 Threat of substitutes
- Exhibit 27: Threat of substitutes – Impact of key factors in 2022 and 2027
- 5.6 Threat of rivalry
- Exhibit 28: Threat of rivalry – Impact of key factors in 2022 and 2027
- 5.7 Market condition
- Exhibit 29: Chart on Market condition - Five forces 2022 and 2027
6 Market Segmentation by Application
- 6.1 Market segments
- Exhibit 30: Chart on Application - Market share 2022-2027 (%)
- Exhibit 31: Data Table on Application - Market share 2022-2027 (%)
- 6.2 Comparison by Application
- Exhibit 32: Chart on Comparison by Application
- Exhibit 33: Data Table on Comparison by Application
- 6.3 Commercial - Market size and forecast 2022-2027
- Exhibit 34: Chart on Commercial - Market size and forecast 2022-2027 ($ billion)
- Exhibit 35: Data Table on Commercial - Market size and forecast 2022-2027 ($ billion)
- Exhibit 36: Chart on Commercial - Year-over-year growth 2022-2027 (%)
- Exhibit 37: Data Table on Commercial - Year-over-year growth 2022-2027 (%)
- 6.4 Residential - Market size and forecast 2022-2027
- Exhibit 38: Chart on Residential - Market size and forecast 2022-2027 ($ billion)
- Exhibit 39: Data Table on Residential - Market size and forecast 2022-2027 ($ billion)
- Exhibit 40: Chart on Residential - Year-over-year growth 2022-2027 (%)
- Exhibit 41: Data Table on Residential - Year-over-year growth 2022-2027 (%)
- 6.5 Infrastructure - Market size and forecast 2022-2027
- Exhibit 42: Chart on Infrastructure - Market size and forecast 2022-2027 ($ billion)
- Exhibit 43: Data Table on Infrastructure - Market size and forecast 2022-2027 ($ billion)
- Exhibit 44: Chart on Infrastructure - Year-over-year growth 2022-2027 (%)
- Exhibit 45: Data Table on Infrastructure - Year-over-year growth 2022-2027 (%)
- 6.6 Market opportunity by Application
- Exhibit 46: Market opportunity by Application ($ billion)
7 Market Segmentation by Product
- 7.1 Market segments
- Exhibit 47: Chart on Product - Market share 2022-2027 (%)
- Exhibit 48: Data Table on Product - Market share 2022-2027 (%)
- 7.2 Comparison by Product
- Exhibit 49: Chart on Comparison by Product
- Exhibit 50: Data Table on Comparison by Product
- 7.3 Earthmoving machinery - Market size and forecast 2022-2027
- Exhibit 51: Chart on Earthmoving machinery - Market size and forecast 2022-2027 ($ billion)
- Exhibit 52: Data Table on Earthmoving machinery - Market size and forecast 2022-2027 ($ billion)
- Exhibit 53: Chart on Earthmoving machinery - Year-over-year growth 2022-2027 (%)
- 展览54:数据表在土方机械Year-over-year growth 2022-2027 (%)
- 7.4 Material handling machinery - Market size and forecast 2022-2027
- Exhibit 55: Chart on Material handling machinery - Market size and forecast 2022-2027 ($ billion)
- Exhibit 56: Data Table on Material handling machinery - Market size and forecast 2022-2027 ($ billion)
- Exhibit 57: Chart on Material handling machinery - Year-over-year growth 2022-2027 (%)
- Exhibit 58: Data Table on Material handling machinery - Year-over-year growth 2022-2027 (%)
- 7.5混凝土和道路建设achinery - Market size and forecast 2022-2027
- Exhibit 59: Chart on Concrete and road construction machinery - Market size and forecast 2022-2027 ($ billion)
- Exhibit 60: Data Table on Concrete and road construction machinery - Market size and forecast 2022-2027 ($ billion)
- Exhibit 61: Chart on Concrete and road construction machinery - Year-over-year growth 2022-2027 (%)
- Exhibit 62: Data Table on Concrete and road construction machinery - Year-over-year growth 2022-2027 (%)
- 7.6 Others - Market size and forecast 2022-2027
- Exhibit 63: Chart on Others - Market size and forecast 2022-2027 ($ billion)
- Exhibit 64: Data Table on Others - Market size and forecast 2022-2027 ($ billion)
- Exhibit 65: Chart on Others - Year-over-year growth 2022-2027 (%)
- Exhibit 66: Data Table on Others - Year-over-year growth 2022-2027 (%)
- 7.7 Market opportunity by Product
- Exhibit 67: Market opportunity by Product ($ billion)
8 Customer Landscape
- 8.1 Customer landscape overview
- Exhibit 68: Analysis of price sensitivity, lifecycle, customer purchase basket, adoption rates, and purchase criteria
9 Geographic Landscape
- 9.1 Geographic segmentation
- Exhibit 69: Chart on Market share by geography 2022-2027 (%)
- Exhibit 70: Data Table on Market share by geography 2022-2027 (%)
- 9.2 Geographic comparison
- Exhibit 71: Chart on Geographic comparison
- Exhibit 72: Data Table on Geographic comparison
- 9.3亚太地区市场规模和预测2022 - 2027
- Exhibit 73: Chart on APAC - Market size and forecast 2022-2027 ($ billion)
- Exhibit 74: Data Table on APAC - Market size and forecast 2022-2027 ($ billion)
- Exhibit 75: Chart on APAC - Year-over-year growth 2022-2027 (%)
- Exhibit 76: Data Table on APAC - Year-over-year growth 2022-2027 (%)
- 9.4North America- Market size and forecast 2022-2027
- Exhibit 77: Chart onNorth America- Market size and forecast 2022-2027 ($ billion)
- Exhibit 78: Data Table onNorth America- Market size and forecast 2022-2027 ($ billion)
- Exhibit 79: Chart onNorth America- Year-over-year growth 2022-2027 (%)
- Exhibit 80: Data Table onNorth America- Year-over-year growth 2022-2027 (%)
- 9.5Europe- Market size and forecast 2022-2027
- Exhibit 81: Chart onEurope- Market size and forecast 2022-2027 ($ billion)
- Exhibit 82: Data Table onEurope- Market size and forecast 2022-2027 ($ billion)
- Exhibit 83: Chart onEurope- Year-over-year growth 2022-2027 (%)
- Exhibit 84: Data Table onEurope- Year-over-year growth 2022-2027 (%)
- 9.6南美- Market size and forecast 2022-2027
- Exhibit 85: Chart on南美- Market size and forecast 2022-2027 ($ billion)
- Exhibit 86: Data Table on南美- Market size and forecast 2022-2027 ($ billion)
- Exhibit 87: Chart on南美- Year-over-year growth 2022-2027 (%)
- Exhibit 88: Data Table on南美- Year-over-year growth 2022-2027 (%)
- 9.7Middle EastandAfrica- Market size and forecast 2022-2027
- Exhibit 89: Chart onMiddle EastandAfrica- Market size and forecast 2022-2027 ($ billion)
- Exhibit 90: Data Table onMiddle EastandAfrica- Market size and forecast 2022-2027 ($ billion)
- Exhibit 91: Chart onMiddle EastandAfrica- Year-over-year growth 2022-2027 (%)
- Exhibit 92: Data Table onMiddle EastandAfrica- Year-over-year growth 2022-2027 (%)
- 9.8 US - Market size and forecast 2022-2027
- Exhibit 93: Chart on US - Market size and forecast 2022-2027 ($ billion)
- Exhibit 94: Data Table on US - Market size and forecast 2022-2027 ($ billion)
- Exhibit 95: Chart on US - Year-over-year growth 2022-2027 (%)
- Exhibit 96: Data Table on US - Year-over-year growth 2022-2027 (%)
- 9.9China- Market size and forecast 2022-2027
- Exhibit 97: Chart onChina- Market size and forecast 2022-2027 ($ billion)
- Exhibit 98: Data Table onChina- Market size and forecast 2022-2027 ($ billion)
- Exhibit 99: Chart onChina- Year-over-year growth 2022-2027 (%)
- Exhibit 100: Data Table onChina- Year-over-year growth 2022-2027 (%)
- 9.10India- Market size and forecast 2022-2027
- Exhibit 101: Chart onIndia- Market size and forecast 2022-2027 ($ billion)
- Exhibit 102: Data Table onIndia- Market size and forecast 2022-2027 ($ billion)
- Exhibit 103: Chart onIndia- Year-over-year growth 2022-2027 (%)
- Exhibit 104: Data Table onIndia- Year-over-year growth 2022-2027 (%)
- 9.11Germany- Market size and forecast 2022-2027
- Exhibit 105: Chart onGermany- Market size and forecast 2022-2027 ($ billion)
- Exhibit 106: Data Table onGermany- Market size and forecast 2022-2027 ($ billion)
- Exhibit 107: Chart onGermany- Year-over-year growth 2022-2027 (%)
- Exhibit 108: Data Table onGermany- Year-over-year growth 2022-2027 (%)
- 9.12Japan- Market size and forecast 2022-2027
- Exhibit 109: Chart onJapan- Market size and forecast 2022-2027 ($ billion)
- Exhibit 110: Data Table onJapan- Market size and forecast 2022-2027 ($ billion)
- Exhibit 111: Chart onJapan- Year-over-year growth 2022-2027 (%)
- Exhibit 112: Data Table onJapan- Year-over-year growth 2022-2027 (%)
- 9.13 Market opportunity by geography
- Exhibit 113: Market opportunity by geography ($ billion)
10 Drivers, Challenges, and Trends
- 10.1 Market drivers
- 10.2 Market challenges
- 10.3 Impact of drivers and challenges
- Exhibit 114: Impact of drivers and challenges in 2022 and 2027
- 10.4 Market trends
11 Vendor Landscape
- 11.1 Overview
- 11.2 Vendor landscape
- Exhibit 115: Overview on Criticality of inputs and Factors of differentiation
- 11.3 Landscape disruption
- Exhibit 116: Overview on factors of disruption
- 11.4 Industry risks
- Exhibit 117: Impact of key risks on business
12 Vendor Analysis
- 12.1 Vendors covered
- Exhibit 118: Vendors covered
- 12.2 Market positioning of vendors
- Exhibit 119: Matrix on vendor position and classification
- 12.3 AB Volvo
- Exhibit 120: AB Volvo - Overview
- 121年展览:AB沃尔沃——业务部门
- Exhibit 122: AB Volvo - Key offerings
- Exhibit 123: AB Volvo - Segment focus
- 12.4 Caterpillar Inc.
- Exhibit 124: Caterpillar Inc. - Overview
- Exhibit 125: Caterpillar Inc. - Business segments
- Exhibit 126: Caterpillar Inc. - Key offerings
- Exhibit 127: Caterpillar Inc. - Segment focus
- 12.5 CNH Industrial NV
- Exhibit 128: CNH Industrial NV - Overview
- Exhibit 129: CNH Industrial NV - Business segments
- Exhibit 130: CNH Industrial NV - Key news
- Exhibit 131: CNH Industrial NV - Key offerings
- Exhibit 132: CNH Industrial NV - Segment focus
- 12.6 Deere and Co.
- Exhibit 133: Deere and Co. - Overview
- Exhibit 134: Deere and Co. - Business segments
- Exhibit 135: Deere and Co. - Key news
- Exhibit 136: Deere and Co. - Key offerings
- Exhibit 137: Deere and Co. - Segment focus
- 12.7 Doosan Bobcat Inc.
- Exhibit 138: Doosan Bobcat Inc. - Overview
- Exhibit 139: Doosan Bobcat Inc. - Business segments
- Exhibit 140: Doosan Bobcat Inc. - Key news
- Exhibit 141: Doosan Bobcat Inc. - Key offerings
- Exhibit 142: Doosan Bobcat Inc. - Segment focus
- 12.8 Hitachi Ltd.
- Exhibit 143: Hitachi Ltd. - Overview
- Exhibit 144: Hitachi Ltd. - Business segments
- Exhibit 145: Hitachi Ltd. - Key news
- Exhibit 146: Hitachi Ltd. - Key offerings
- Exhibit 147: Hitachi Ltd. - Segment focus
- 12.9 Hyundai Motor Co.
- Exhibit 148: Hyundai Motor Co. - Overview
- Exhibit 149: Hyundai Motor Co. - Business segments
- Exhibit 150: Hyundai Motor Co. - Key news
- Exhibit 151: Hyundai Motor Co. - Key offerings
- Exhibit 152: Hyundai Motor Co. - Segment focus
- 12.10 J C Bamford Excavators Ltd.
- Exhibit 153: J C Bamford Excavators Ltd. - Overview
- Exhibit 154: J C Bamford Excavators Ltd. - Product / Service
- Exhibit 155: J C Bamford Excavators Ltd. - Key offerings
- 12.11 Kawasaki Heavy Industries Ltd.
- Exhibit 156: Kawasaki Heavy Industries Ltd. - Overview
- Exhibit 157: Kawasaki Heavy Industries Ltd. - Business segments
- Exhibit 158: Kawasaki Heavy Industries Ltd. - Key news
- 159年展览:川崎重工有限公司-键offerings
- Exhibit 160: Kawasaki Heavy Industries Ltd. - Segment focus
- 12.12 Kobe Steel Ltd.
- Exhibit 161: Kobe Steel Ltd. - Overview
- Exhibit 162: Kobe Steel Ltd. - Business segments
- Exhibit 163: Kobe Steel Ltd. - Key offerings
- Exhibit 164: Kobe Steel Ltd. - Segment focus
- 12.13 Komatsu Ltd.
- Exhibit 165: Komatsu Ltd. - Overview
- Exhibit 166: Komatsu Ltd. - Business segments
- Exhibit 167: Komatsu Ltd. - Key news
- Exhibit 168: Komatsu Ltd. - Key offerings
- Exhibit 169: Komatsu Ltd. - Segment focus
- 12.14 Liebherr International AG
- Exhibit 170: Liebherr International AG - Overview
- Exhibit 171: Liebherr International AG - Product / Service
- Exhibit 172: Liebherr International AG - Key news
- Exhibit 173: Liebherr International AG - Key offerings
- 12.15 Manitou Group
- Exhibit 174: Manitou Group - Overview
- Exhibit 175: Manitou Group - Product / Service
- Exhibit 176: Manitou Group - Key offerings
- 12.16 SANY Group
- Exhibit 177: SANY Group - Overview
- Exhibit 178: SANY Group - Product / Service
- Exhibit 179: SANY Group - Key offerings
- 12.17 Terex Corp.
- Exhibit 180: Terex Corp. - Overview
- Exhibit 181: Terex Corp. - Business segments
- Exhibit 182: Terex Corp. - Key offerings
- Exhibit 183: Terex Corp. - Segment focus
13 Appendix
- 13.1 Scope of the report
- 13.2 Inclusions and exclusions checklist
- Exhibit 184: Inclusions checklist
- Exhibit 185: Exclusions checklist
- 13.3 Currency conversion rates for US$
- Exhibit 186: Currency conversion rates for US$
- 13.4 Research methodology
- Exhibit 187: Research methodology
- Exhibit 188: Validation techniques employed for market sizing
- Exhibit 189: Information sources
- 13.5 List of abbreviations
- Exhibit 190: List of abbreviations
About Us
Technavio is a leading global technology research and advisory company. Their research and analysis focuses on emerging market trends and provides actionable insights to help businesses identify market opportunities and develop effective strategies to optimize their market positions. With over 500 specialized analysts, Technavio's report library consists of more than 17,000 reports and counting, covering 800 technologies, spanning across 50 countries. Their client base consists of enterprises of all sizes, including more than 100 Fortune 500 companies. This growing client base relies on Technavio's comprehensive coverage, extensive research, and actionable market insights to identify opportunities in existing and potential markets and assess their competitive positions within changing market scenarios.
Contact
Technavio Research
Jesse Maida
Media & Marketing Executive
US: +1 844 364 1100
UK: +44 203 893 3200
Email:[email protected]
Website:www.technavio.com/
SOURCE Technavio


Share this article